

Social Media Marketing KPIs You Should Track
A monthly report can show more followers, views, and likes while leaving one question unanswered: did social media help the business? A retailer may need online orders; a B2B firm may need qualified enquiries; a local service business may need bookings. The same impressive-looking post can have very different value for each.
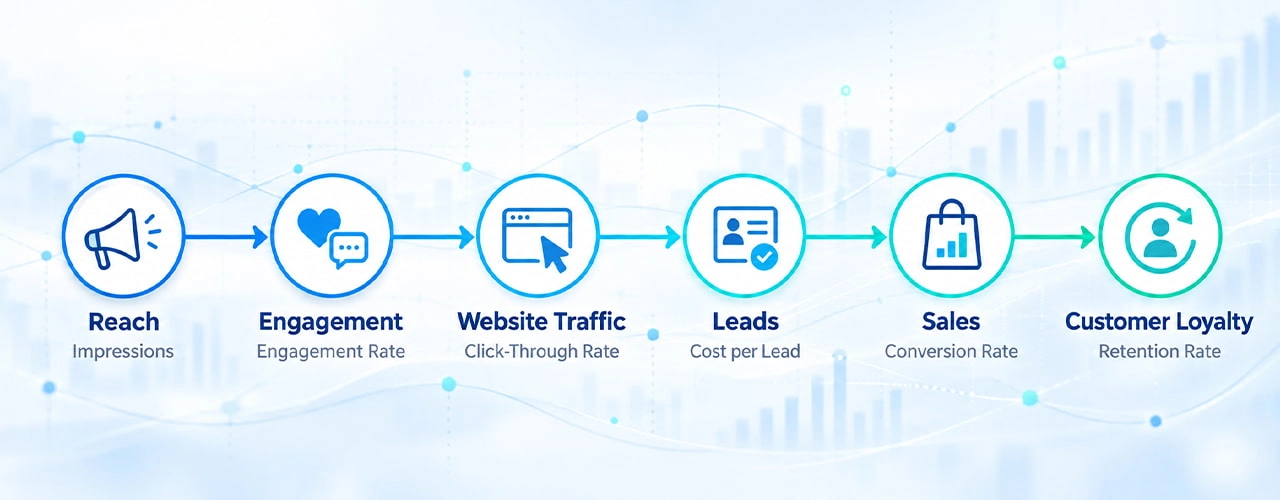
The most important social media marketing KPIs are the ones tied to your goal: reach and mentions for awareness; engagement rate and meaningful interactions for audience interest; social traffic and click-through rate for website visits; qualified leads and cost per lead for demand generation; and sales, acquisition cost, and return on investment for revenue. If customers seek help through social channels, add response time and resolution measures. Track a small set from the relevant stages, then ask what action the numbers suggest.
What Are Social Media KPIs?
Social media marketing KPIs are measurable values businesses use to evaluate whether their social media activities are helping achieve marketing goals.
A goal is what you want to accomplish, such as more consultation requests. A metric is any recorded number, such as post impressions or website sessions. A KPI is a metric you choose to judge progress toward that goal, usually with a target and timeframe. The business outcome is the result that matters, such as consultations that turn into customers.
For example, “increase qualified enquiries from LinkedIn this quarter” is a goal. LinkedIn-driven qualified enquiries per month is a KPI. Impressions and clicks are useful supporting metrics; signed contracts are the downstream business outcome. This distinction keeps a large dashboard from becoming a list of numbers with no decision attached.
Not Sure Which Social Media KPIs Matter for Your Business?
Track the metrics that actually impact your marketing goals. Get expert insights to identify performance gaps, improve campaigns, and make data-driven decisions.
Why Social Media KPIs Matter to a Business
Good measurement tells you where people encounter your brand, what they find useful, and whether interest turns into action. It also helps decide where the next hour of content work or the next unit of ad budget should go.
Consider a product video that reaches many people but sends few visitors to the product page. If awareness was the goal, the video may have worked. If sales were the goal, the team should inspect the offer, link placement, audience, and landing page. The same social media performance metrics need interpretation in the context of the campaign.
Decision-makers need this connection to allocate budgets. Content teams use it to improve topics and formats. Paid media teams use it to compare audiences and creative. Customer teams can spot recurring questions that deserve a clearer answer on the website or in future posts.
Key Social Media Marketing KPIs You Should Track

The six categories below cover the journey from first exposure to customer relationship. You do not need every metric in every report.
1. Reach and Awareness KPIs: Are the Right People Seeing You?
Reach estimates the number of distinct accounts exposed to content; impressions count appearances, so one person can account for several impressions. Brand mentions show when people bring up your business, while follower growth rate puts new followers in proportion to your starting audience.
Follower growth rate = (ending followers − starting followers) ÷ starting followers × 100. If an account grows from 2,000 to 2,100 followers, growth is 5% for that period. Check whether those followers fit your target market before calling it success.
Awareness KPIs matter for a launch or an unfamiliar brand. Segment results by platform, audience, location, and organic versus paid activity where the data allows. A surge in impressions outside the market you serve is a weak result even if the total looks strong. Mentions also need context: a complaint is different from a recommendation.
2. Engagement KPIs: Is the Content Useful Enough to Act On?
Likes are a quick signal, but comments, shares, saves, and relevant replies often reveal more about what people valued. A saved tutorial may indicate that someone intends to use it later; a comment asking about delivery may show purchase intent. Read the substance of interactions as well as counting them.
Engagement rate = selected engagements ÷ selected exposure measure × 100. For example, if a post receives 120 likes, comments, shares, and saves from 4,000 reached accounts, its engagement rate by reach is 3%. Some teams divide by impressions or followers instead. State which interactions and denominator you use, and keep the definition consistent when comparing periods. Platform-reported engagement can include different actions, so cross-platform rates may not be directly comparable.
Track social media engagement metrics when your goal is to build a community, test content relevance, or encourage conversation. Pair the rate with the absolute number of meaningful interactions: a high rate on a tiny audience may still have limited business impact.
3. Website Traffic KPIs: Does Interest Carry Through?
Useful measures include link clicks, click-through rate (CTR), social-referred website sessions, landing page visits, and what visitors do after arrival. Link CTR = link clicks ÷ eligible impressions × 100 when the platform provides those figures. Use link clicks rather than a platform’s broader “all clicks” figure if the goal is website visits.
Suppose a campaign has a healthy CTR but visitors leave the landing page without making an enquiry. The post has created interest, but the page may not answer the question the post raised. Inspect engaged sessions, key actions, and mobile experience before increasing spend.
Use consistent campaign tags on destination links to distinguish platforms, campaigns, and creative. Google Analytics 4’s Traffic acquisition report can show session source or medium and key-event performance; Google documents manual UTM tagging for identifying campaign traffic. Platform click totals and website sessions can differ, so compare trends and definitions instead of expecting a perfect match.
4. Lead Generation KPIs: Are Enquiries Worth Following Up?
Count leads from website forms, calls, messages, bookings, and in-platform lead forms. Agree in advance what qualifies as a lead and how duplicate submissions will be handled. Then track the proportion that become sales-accepted or qualified opportunities, not just the number submitted.
Lead conversion rate = leads ÷ chosen base × 100. The base might be landing page sessions, link clicks, or completed lead-form opens; label it clearly. Cost per lead (CPL) = campaign cost ÷ leads generated. A campaign that produces 40 enquiries at a low CPL may still underperform one with 15 enquiries if few of the 40 are relevant or reachable.
For a B2B service, pass source and campaign details into the CRM where possible. Review qualified lead rate and eventual pipeline value with the sales team. That closes the gap between social media analytics and the quality of opportunities the business actually receives.
5. Conversion and Revenue KPIs: Does Social Contribute to Sales?
Track purchases or booked services associated with social activity, attributed revenue, customer acquisition cost, and social media ROI. Customer acquisition cost for a defined social campaign = relevant campaign and production cost ÷ new customers acquired through that campaign. Keep cost and customer scope aligned; do not divide a full quarter’s social costs by customers from one ad.
For a margin-aware calculation, social media ROI = (attributable gross profit − total social marketing cost) ÷ total social marketing cost × 100. Total cost can include media spend, production, tools, and labor allocated to the campaign. If an illustrative campaign produces $12,000 in attributed sales at a 40% gross margin and costs $3,000, attributable gross profit is $4,800 and the calculated ROI is 60%. These are hypothetical figures, and the result depends on the attribution method.
An attributed sale is not proof that social media alone caused it. A customer might see a post, search for reviews, click a paid search ad, and return directly to buy. Document the attribution window and model used, and consider both assisted influence and directly attributed conversions. Compare paid social with other digital marketing KPIs using the same cost and conversion definitions. Where transaction values are unavailable, report qualified pipeline or bookings and describe them as such instead of presenting a precise revenue ROI.
6. Customer Service KPIs: Are You Helping People Who Reach Out?
If customers use comments or direct messages for support, monitor first response time, response rate, resolution time or rate, and the volume and themes of support-related interactions. Record sentiment alongside examples: a rise in negative comments may expose a product or service issue before it appears elsewhere.
Fast replies alone are not enough. A team can answer quickly and still fail to resolve a problem. A monthly review of recurring questions can improve help content, product pages, and handoffs to customer service. Interpret sentiment carefully, especially when volume is small or automated classification gets the context wrong.
Social Media KPIs by Business Goal

Business goal | Primary KPIs | Supporting check | Decision the report should inform |
Brand awareness | Target-market reach, relevant mentions | Impressions, follower growth | Which audiences and topics are gaining recognition? |
Engagement | Meaningful comments, shares, saves, engagement rate | Reply themes | Which content deserves more development? |
Website growth | Social-referred sessions, link CTR | Landing page engagement | Do the post and destination match? |
Lead generation | Qualified leads, qualified-lead rate, CPL | Lead-to-customer progression | Which campaigns bring useful enquiries? |
Sales growth | Attributed sales, acquisition cost, ROI | Margin and assisted conversions | Where should budget be increased or reduced? |
Customer care | Response time, resolution rate | Sentiment and recurring issues | What needs a service or content fix? |
For a campaign spanning the funnel, select one primary business KPI and a few diagnostic measures. A report that lists every available number can obscure the result it was meant to explain.
How to Choose the Right Social Media KPIs
Start with a business question: “Are we getting more qualified demo requests?” or “Are nearby customers finding our new location?” Choose the outcome, then work backward to the social action and the earlier signal you can measure.
Define each KPI in the reporting plan: platform, campaign, organic or paid scope, formula, data source, owner, target, and review period. Record the baseline before setting a target. A new account, a mature community, and a seasonal business should not use the same expectation by default.
Match the KPI to the customer’s stage. Discovery calls for reach among relevant people. Consideration calls for useful engagement and qualified visits. Decision calls for leads, sales, and acquisition economics. After purchase, service interactions and resolution become important. Keep secondary numbers available for diagnosis without putting all of them on the executive scorecard.
How to Build a Social Media Report People Can Use
A useful report fits on a short scorecard before it opens into detail:
- State the goal and period. Show the KPI, target, current result, and comparable prior period.
- Separate organic and paid activity. A budget increase can make reach rise even when content effectiveness falls.
- Trace the path. Show relevant exposure, link visits, conversions, lead quality, and revenue where each is measurable.
- Explain a change. Note launches, spend, seasonality, creative changes, tracking problems, and sample size.
- Name the next action. For example: retain the topic that generates qualified enquiries, test a clearer call to action, or fix a mobile landing page.
Review active campaigns weekly for delivery and obvious problems; review outcomes and lead quality monthly. Use a quarterly view for slower sales cycles. Avoid judging a long B2B buying journey solely by this week’s sales or treating one viral post as a reliable trend.
Common Mistakes When Tracking Social Media KPIs
- Reporting followers as the result. Audience growth helps only when the audience is relevant and moves toward the intended outcome.
- Ignoring conversions or lead quality. A cheap lead may be expensive once the sales team spends time filtering it.
- Measuring everything. Pick the few numbers that change a decision, then use the rest to investigate why they moved.
- Comparing unlike periods or formulas. Keep date ranges, campaign scope, and denominators consistent, and annotate major changes.
- Leaving social data inside platforms. Without tagged links, website analytics, and appropriate CRM records, it is difficult to connect posts with enquiries and customers.
- Treating attribution as certainty. Platform and website reports can assign credit differently. State the method and its limits instead of adding their conversion totals together.
Tools to Track Social Media Marketing KPIs
| Tool | Useful for | Limit to remember |
| Google Analytics 4 | Social-referred website sessions, landing pages, key events, and traffic-source comparisons | Requires sound tagging and event setup; website and platform counts may differ. |
| Meta Business Suite and Meta ad reporting | Facebook and Instagram content, audience interactions, and campaign results | Use a consistent organic or paid scope and check metric definitions in the account. |
| LinkedIn Analytics and Campaign Manager | Page or content response, ad clicks, demographics, leads, and tracked conversions | CRM qualification may tell a different story from raw lead totals. |
| TikTok Analytics or Web Business Suite | Video response, followers, reach, engagement, and available conversion data | Watch behavior needs to be linked to the campaign goal. |
| Social media management platforms | Cross-account scheduling, monitoring, and combined reporting | A unified dashboard does not make platform definitions identical. |
Using Social Media Data Across the Marketing Strategy
Social media often reveals a question before someone is ready to buy. Repeated comments can inform a content article; strong post traffic with weak enquiries can point to a conversion rate optimization issue; a topic with qualified organic engagement may be worth testing in paid advertising. Search, paid campaigns, website experience, and CRM data provide the context that a platform dashboard alone cannot.
At TechHaz, we connect social media strategy, analytics, content, website experience, and conversion-focused campaigns around the same business goals. The focus is not simply on collecting data, but on using it to make better decisions, whether that means improving a message, refining an audience, optimising a landing page, or investing more in campaigns that generate qualified opportunities.
A Better Question for the Next Report
When a metric rises or falls, ask what it means for the goal and what the team should change. Reach may show that more people discovered the brand; qualified enquiries may show whether the right people took the next step. Keeping both in view makes social media reporting useful to the people who create campaigns and the people who fund them.
FAQ's
1. What are social media manager KPIs?
Social media KPIs are measurable signs used to gauge how well your social media advertising supports your commercial enterprise goals. Examples include reach, engagement rate, CTR, conversions, and social media ROI.
2. What are the best social media KPIs for lead generation?
For lead generation, important metrics to track include lead turnover rate, cost per lead, clicks, and click-through rate. Businesses should monitor these metrics in the context of social media advertising to better understand their lead generation performance.
3. How often should you track social media performance metrics?
Monitoring social media metrics is important, but there are overwhelmingly more metrics available than are practical to track. Focus on a few key performance indicators.
4. What tools can be used to track social media KPIs?
Analytics are available on platforms such as Meta, LinkedIn, X, TikTok, and YouTube. Businesses can also use other reporting tools, including Google Analytics 4, Sprout Social, Hootsuite, Buffer, Agorapulse, Looker Studio, and Excel.
5. How do you choose the right social media KPIs?
KPIs change based on the social media goal. For brand awareness, look at post reach and impressions. For engagement, look at the engagement rate. For lead generation, look at cost per lead, click-through rate, and conversion rate.